|
||||||
Monthly Regional Summary |
||||||
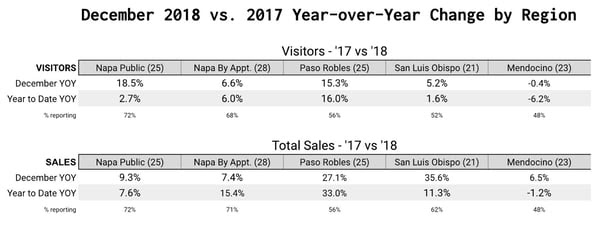
| We hope you find the year over year regional community benchmarks below valuable for your tasting room’s visitation and sales.
* How to read this chart: “The average tasting room in Napa has changed XX% this year.” The number next to each region is how many wineries are participating, and the percentage below shows how many of those are reporting data for this time period. |
||||||
Wine Symposium Success |
||||||
Did you have a chance to attend the big DTC Wine Symposium in Concord this month?
|
||||||
Partnerships with Business Impact & WISE |
||||||
| We are continuing to build ways to simplify the process of getting your data in so that we can help you get to your opportunities and insights faster.
Business Impact helps us do just that and we are already working to automate the data import each month with a few wineries. We are also very excited to be working with WISE – the Wine Industry Sales Education. Check out some of their great work here on their site. |
||||||
Log in & enter your Data |
||||||
| Our goal is always to help you discover your specific insights and areas for improvement and profitability in your tasting room. To learn more or book a demo, click here; for existing members, today is the perfect day to log in here and enter your data to see where you stand: | ||||||
| As always, we welcome any feedback and thank you for being a part of our community!
Cheers! – John & Team Community Benchmark PS – Help spread the love! Know anyone that would benefit from knowing where they stand relative to their community? Referrals are always warmly welcomed.
REQUEST A DEMO TODAY AND DISCOVER YOUR INSIGHTS TOMORROW |
||||||


