|
||||||
Monthly Regional Summary |
||||||
| We hope you find the year over year community benchmarks below valuable for Community Benchmark visitation and sales.
The wildfires of last October had a major impact on sales; how did this October compare?
|
||||||
Vin65/WineDirect integrations in pilot phase |
||||||
| We have been hard at work to get integrated with the WineDirect API to directly pull monthly metrics into Community Benchmark. If you’re ready to take the next step, reply here and we will help get the API webservice account set up. Our goal is always to help you get to your insights in the best way possible! | ||||||
Am I excluded from the community averages? |
||||||
| Yes. We recently updated the way the benchmarks are calculated and presented so that the community data that you see excludes yourself. The main effect this has is that you will appear farther away from the average in{REGION}.
Your data is still included in the community, but when you look at the community data, it will be a more accurate reflection of what is happening in the community around you. |
||||||
Paso Robles Sub-Regions are live |
||||||
| Tasting Rooms in Paso Robles can now refine their comparative set with Community Benchmark using the new sub-region filter. Paso Robles can now filter by West, East and Adelaida Rd. Sub-regions will be coming for Napa Valley! Stay tuned….
|
||||||
Back to Basics Part 3: Increase Revenue by Focusing on Sales Per Purchase
|
||||||
Log in & enter your Data |
||||||
| Our goal is always to help you discover your specific insights and areas for improvement and profitability in your tasting room. To learn more or book a demo, click here; for existing members, today is the perfect day to log in here and enter your data to see where you stand:
|
||||||
| As always, we welcome any feedback and thank you for being a part of our community!
Cheers! – John & Team Community Benchmark PS – Do you have a question you’d like answered? Chances are someone else may too — simply reply to this email with your question and we may feature it on our blog or support tool. PPS – Help spread the love! Know anyone that would benefit from knowing where they stand relative to their community? Referrals are always warmly welcomed.
REQUEST A DEMO TODAY AND DISCOVER YOUR INSIGHTS TOMORROW |
||||||

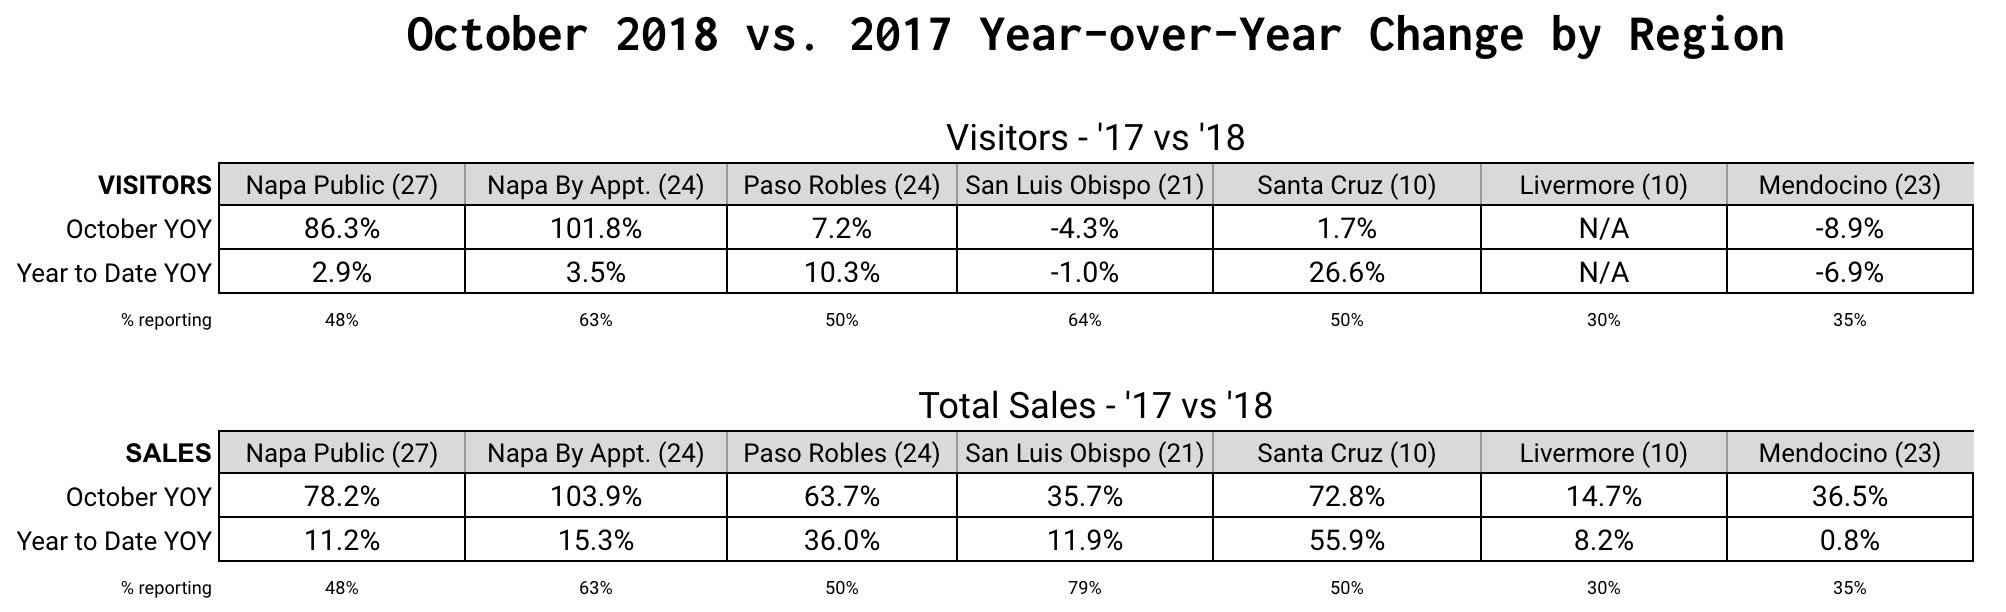 * How to read this chart: “The average tasting room in {REGION} has changed XX% this year.” The number next to each region is how many wineries are participating, and the percentage below shows how many of those are reporting data for this time period.